
What Are Your Numbers Really Telling You?
Facility A delivers 200 personal training sessions each month. Facility B delivers 50. Which facility is performing better?
At first glance, the answer might seem obvious. But the reality is that we simply don't have enough information.
How many members does each facility serve? How many personal trainers are on staff? How many hours are available for training? How are those trainers compensated? What revenue is being generated? What is the program margin? And how do all of those numbers compare with previous months or years?
Facility A may be doing four times as many sessions, but Facility B could actually be utilizing its trainers more effectively, engaging a greater percentage of its membership, or generating a stronger return from the program.
Activity and performance are not the same thing. That distinction is important for all of us who lead medical fitness operations.
Compared with what?
One of the first questions I like to ask when someone shares an operational statistic is simple: Compared with what?
"We generated $2 million in revenue."
"We retained 75% of our members."
"We had 100 physician referrals last quarter."
Those numbers may sound good. But without context, it is difficult to know.
That is why ratios, historical trends, and industry benchmarks are so valuable. Revenue per member, revenue per FTE, payroll as a percentage of revenue, revenue per square foot, percent non-dues revenue, member attrition, and similar measures give us much greater insight than raw numbers alone.
And benchmarks give us something else we need: perspective.
A benchmark should not be viewed as a grade. It is a conversation starter. If our performance differs significantly from an industry benchmark, the next question should be why. There may be a perfectly reasonable explanation based on our facility, market, mission, or operating model. Or the difference may expose an opportunity we need to address.
MFA's Benchmarks for Success gives medical fitness leaders the ability to compare their operations not only with industry averages, but also with the top 25% of facilities based on financial performance. That distinction is important.
If your facility is performing well below average in an important area, start by developing strategies and tactics to close that gap. But once you get there, don't stop.
Average can be a milestone. It shouldn't be the destination. What would it take to become a top-quartile operation?
What gets measured, matters
Of course, benchmarking only helps if we are measuring our own performance in the first place. For organizations that currently measure very little, my advice is not to wait until you can develop the perfect dashboard. Start somewhere.
Choose a manageable number of meaningful indicators. For many facilities, five to ten metrics is a good place to start. Establish consistent definitions. Measure them regularly. Develop a baseline and begin looking at trends.
Financial measures certainly belong there, but they should not be the entire scorecard.
A high-performing medical fitness operation should be looking at a balanced picture of performance that may include financial sustainability, productivity and efficiency, membership growth, retention and engagement, customer experience, workforce stability, clinical integration, and clinical health or fitness outcomes.
A facility could have an outstanding profit margin while experiencing declining membership, poor customer satisfaction, high employee turnover, and little connection to its healthcare system. Conversely, an organization can provide outstanding clinical programming and make a meaningful difference in people's lives while operating under a financial model that is ultimately unsustainable.
Neither represents the complete picture of success. A medical fitness facility should be able to demonstrate both business value and healthcare value.
From information to improvement
Ultimately, collecting data is not the objective. Neither is creating a prettier dashboard.
The value comes from what we do with the information: Measure. Normalize. Compare. Diagnose. Improve. Communicate.
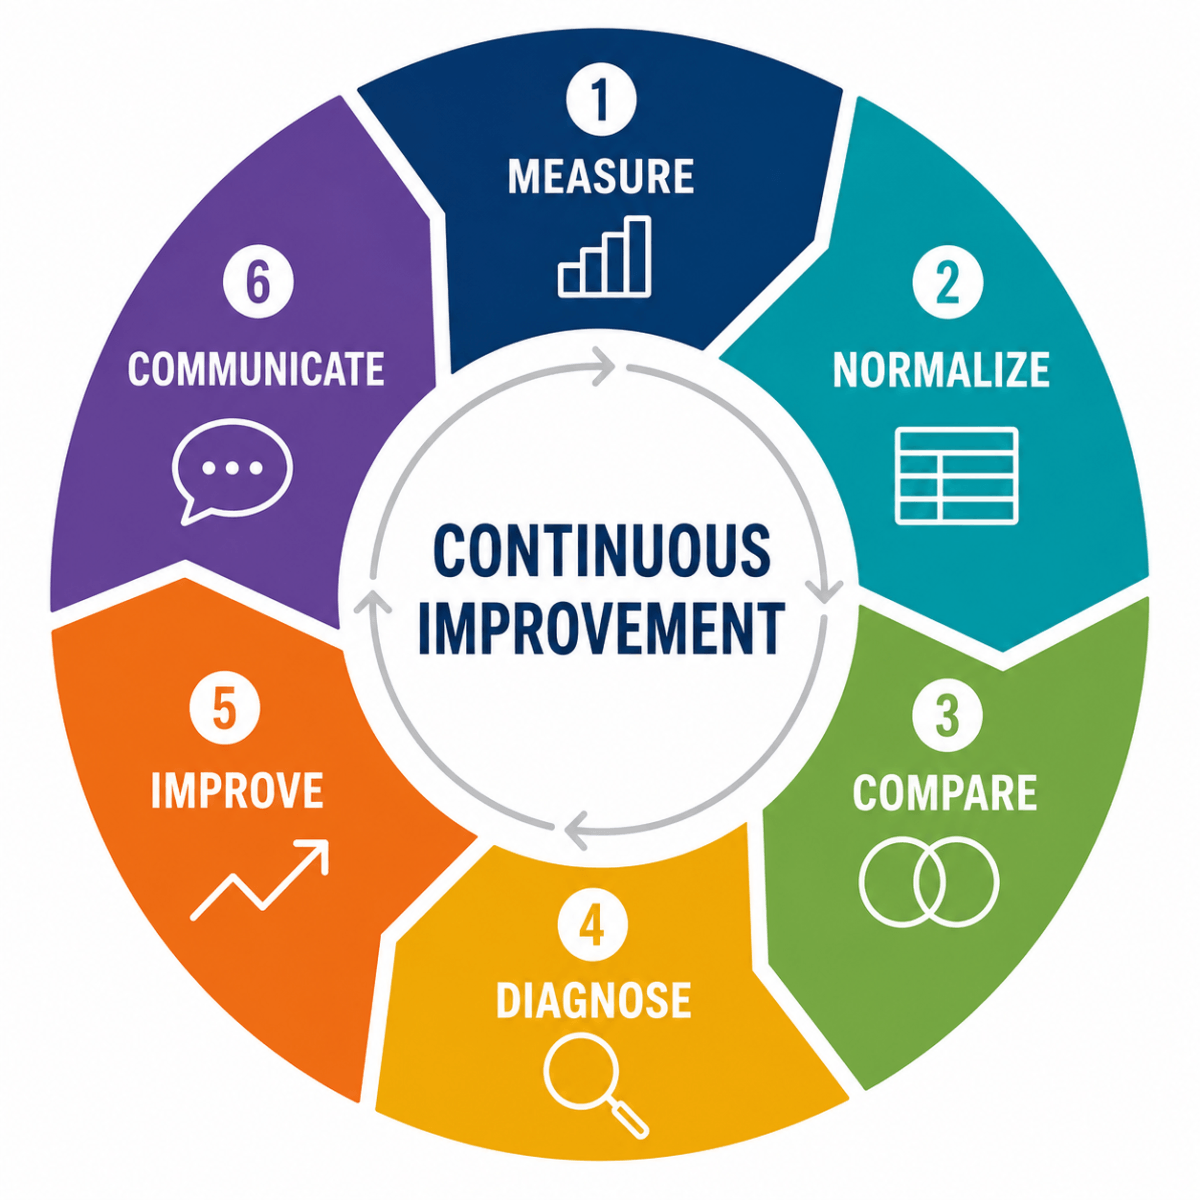
Diagnosing why a gap exists takes more than a spreadsheet. It takes context that often only comes from talking to people who have faced the same gap themselves. And communicating results well means telling different stories to different audiences. Administrators, physicians, staff, members, and community stakeholders may all care about different aspects of our performance.
As we recently released the 2026 MFA Conference Experience Guide, I found myself thinking about how this connects with what I wrote last month about the value of gathering in person. Specifically, the diagnosis step rarely happens alone. A session at conference where two directors compare their retention numbers, or a hallway conversation about how someone closed a staffing gap, does more for the "why" behind a benchmark than another quarter of data ever could.
The numbers can tell you that you look more like Facility A or Facility B. The conversations at the MFA Annual Conference are often what help you figure out why and what to do about it.
The best response to an impressive number is, "That's great; compared with what?"